Plot a disclapmixfit object.
# S3 method for disclapmixfit
plot(x, which = 1L, clusdist = clusterdist(x), ...)
Arguments
- x
a
disclapmixfitobject, usually from a result of a call todisclapmix.- which
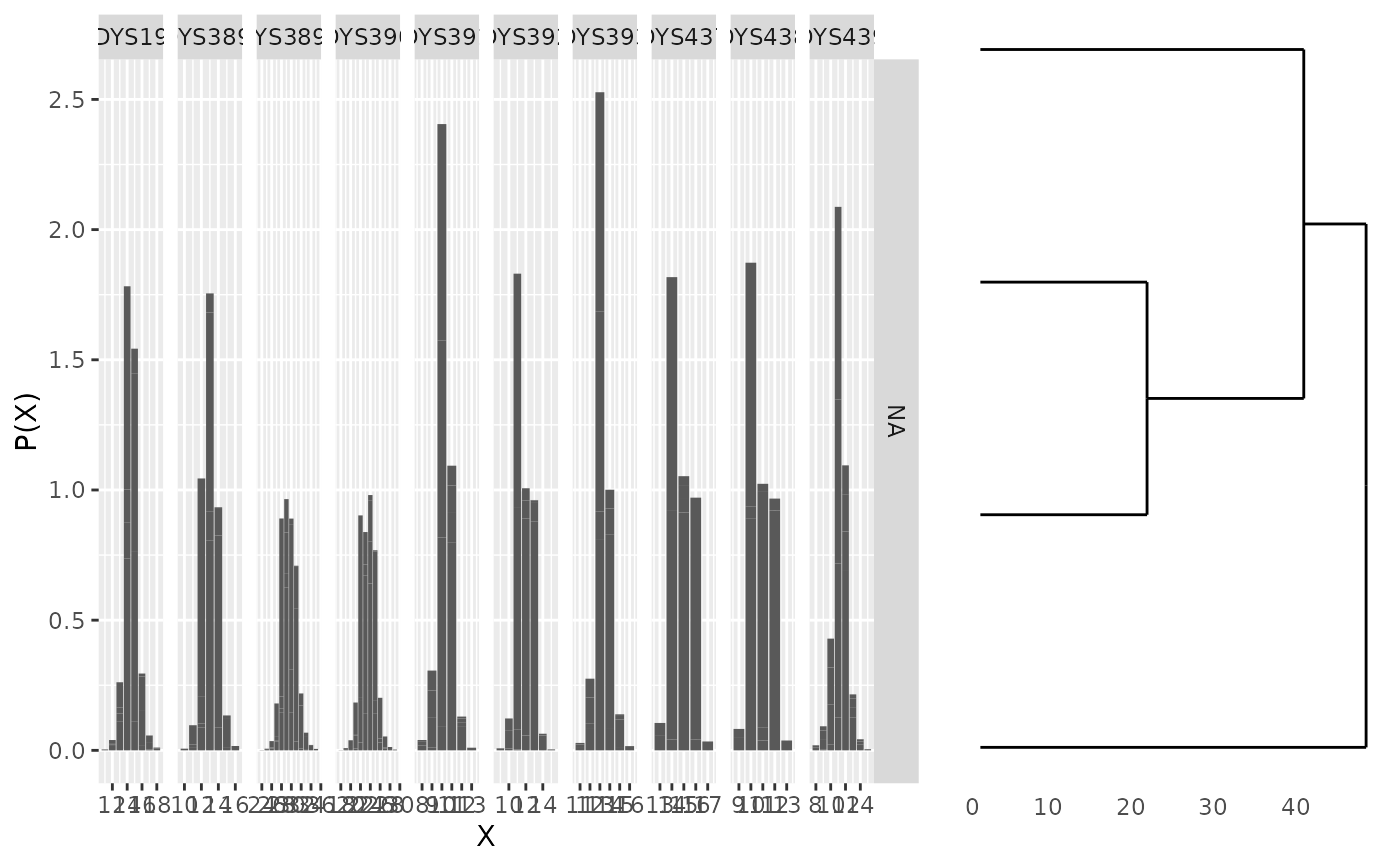
What plot to make. 1L = clusters and their distances.
- clusdist
To use previously computed cluster distances to avoid doing the same computations twice.
- ...
not used
Value
A data frame with discrete Laplace distributions for each cluster and locus. Side effect: A plot.